Tartalomjegyzék
\[ \newenvironment{dcases}{\left\{\begin{array}{ll}}{\end{array}\right.} \]Vektormezők ábrázolási módjai
TELJES MATLAB SCRIPT KIEGÉSZÍTŐ FÜGGVÉNYEKKEL
file:   vektormezok_abrazolasi_modjai.m
author: Peter Polcz <ppolcz@gmail.com>
Created on 2017.07.02. Sunday, 23:58:23
Output:
┌vektormezok_abrazolasi_modjai
│   - Persistence for `vektormezok_abrazolasi_modjai` reused (inherited) [run ID: 7291, 2017.08.27. Sunday, 04:06:03]
│   - Script `vektormezok_abrazolasi_modjai` backuped
Qp = [ 3 2 1 0.3];
rp = [
0 -3 -3 3
1 3 -3 2
];
Qn = [ -1 -2 ];
rn = [
0 2
-1 -2
];
Qs = [Qp Qn];
rs = [rp rn];
n = numel(Qs);
sqrtdist = @(r) sum((r(:,ones(1,n))-rs).^2,1);
F = @(t,r) sum(Qs([1,1],:).*(r(:,ones(1,n))-rs) ./ repmat(sqrtdist(r).^(3/2),[2 1]),2);
Fn = @(t,r) F(t,r) / norm(F(t,r));
axlims = [2 4 1 3];
resolution = 10;
[x,y] = meshgrid(linspace(2.2,3.8,resolution),linspace(1.2,2.8,resolution));
dx = 0*x;
dy = 0*y;
for i = 1:numel(x);
Fi = F(0,[x(i);y(i)]);
dx(i) = Fi(1);
dy(i) = Fi(2);
end
r = (dx.^2 + dy.^2).^0.4;
figure('Position', [ 665 709 886 266 ], 'Color', [1 1 1])
subplot(131), hold on
quiver(x,y,dx./r,dy./r,'b')
plot(x,y,'.b')
axis equal
axis(axlims)
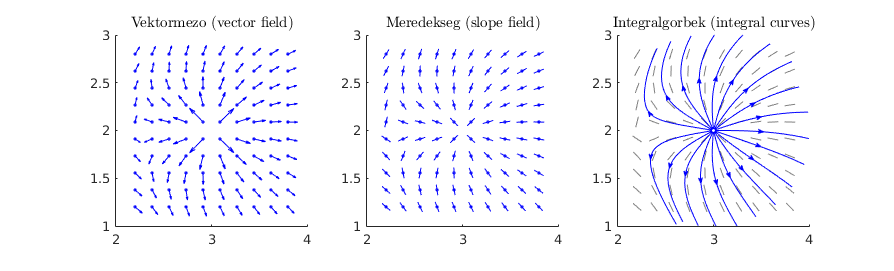
ptitle 'Vektormezo (vector field)'
subplot(132), hold on
pcz_integral_slopes(x,y,dx,dy,'b')
plot(x,y,'.b')
axis equal
axis(axlims)
ptitle 'Meredekseg (slope field)'
subplot(133), hold on
pcz_integral_slopes(x,y,dx,dy,'Color',0.5*[1 1 1])
R_divider = 20;
R = abs(Qp(4))/R_divider;
t = linspace(0,2*pi,20);
X = [ R*cos(t(2:end)) + rp(1,4) ];
Y = [ R*sin(t(2:end)) + rp(2,4) ];
% Integrálgörbék kiszámítása, kisebb időintervallumokon ode45, azért,
% hogy ellenőrizni tudja, ha beragad valahol, vagy már lényegtelenül
% messze repült a megoldás (nem tudok megadni egy általánosan jó
% végidőt az integrálásra)
for i = 1:numel(X)
ri = [X(i);Y(i)];
tt = 0;
xx = ri';
for k = 1:1000
[t_ode,x_ode] = ode45(@(t,x) Fn(t,x),[0,0.1],ri);
tt = [tt ; t_ode(2:end,:)];
xx = [xx ; x_ode(2:end,:)];
found = 0;
for j = 1:numel(Qn)
last = find(sum((x_ode - repmat(rn(:,j)',[size(x_ode,1),1])).^2,2) < 0.01,1);
if ~isempty(last)
found = 1;
break;
end
end
if found, break; end
% norm(x_ode(end,:))
if norm(x_ode(end,:)-[3 2]) > 1, break; end
ri = x_ode(end,:)';
end
% Canonic parametrization of the curve
s = [ 0 ; cumsum(sum(diff(xx,1).^2,2).^0.5) ];
p = interp1(s,xx,s(end)/2,'spline');
q = interp1(s,xx,s(end)/2+0.01,'spline');
pcz_arrow(p(1),p(2),q(1),q(2),'Color','blue','HeadLength',4,'HeadWidth',4);
plot(xx(:,1),xx(:,2),'b')
drawnow
end
axis equal
axis(axlims)
ptitle 'Integralgorbek (integral curves)'
pcz_print vekanal_abrazolasi_modok.png -r300
Output:
│   - File saved to:
vekanal_abrazolasi_modok.png
End of the script.
Output:
└ 5.1428 [sec]