Tartalomjegyzék
\[ \newenvironment{dcases}{\left\{\begin{array}{ll}}{\end{array}\right.} \]Teljes Matlab script kiegészítő függvényekkel.
File: msd_frequency_simulation.m
Directory: 4_gyujtemegy/11_CCS/Modellek/msd
Author: Peter Polcz (ppolcz@gmail.com)
Created on 2020. November 06. (2020b)
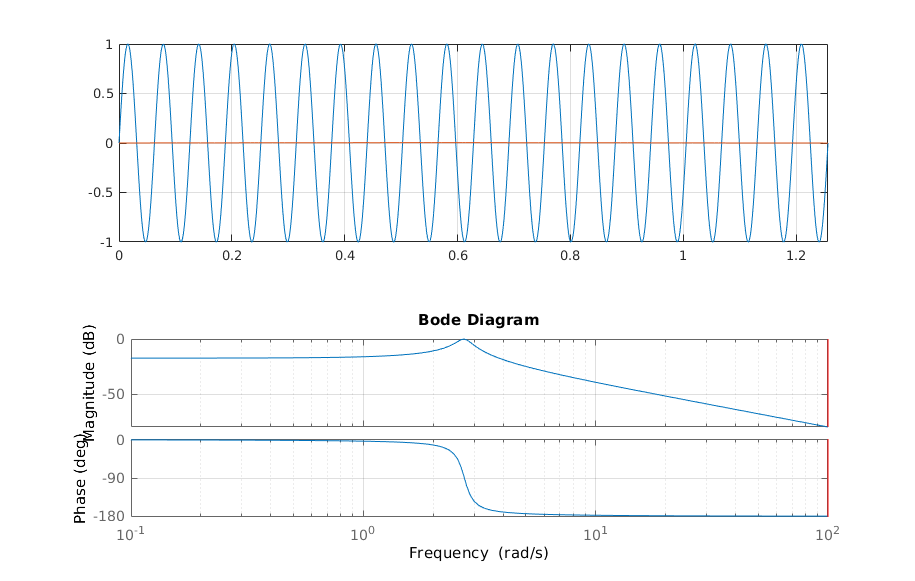
Mass spring damper system
M y'' + b y' + k y = F
x1 = y --> x1' = x2 x2 = y' --> x2' = -k/M x1 - b/M x2 - F/M
Parameter [2]
M = 2.7;
b = 1;
k = 20;

A = [
    0      1
    -k/M  -b/M
    ];
B = [ 0 1 ]';
C = [ 1 0 ];
D = 0;


sys = ss(A,B,C,D);
[mag,phase,w] = bode(sys);

Nr_of_sample_freq = 150;
w = logspace(log10(w(1)),log10(w(end)),Nr_of_sample_freq);

tt = cell(1,Nr_of_sample_freq);
uu = cell(1,Nr_of_sample_freq);
yy = cell(1,Nr_of_sample_freq);

Nr_of_periods_in_simulation = 20;
Nr_of_sample_points = 10000;

for i = 1:Nr_of_sample_freq

    tt{i} = linspace(0,2*pi*Nr_of_periods_in_simulation/w(i),Nr_of_sample_points)';
    uu{i} = sin(w(i)*tt{i});
    yy{i} = lsim(sys,uu{i},tt{i});

end
[ax1,Pl2,Pl3] = simulate(2,sys,w(1),tt{1});

subplot(ax1),
Pl1 = plot(tt{1},[uu{1} yy{1}]);
grid on

for i = 1:numel(w)

    tic

    Pl1(1).XData = tt{i};
    Pl1(1).YData = uu{i};

    Pl1(2).XData = tt{i};
    Pl1(2).YData = yy{i};

    ax1.XLim = [0,2*pi*Nr_of_periods_in_simulation/w(i)];

    Pl2.XData = [1 1]*w(i);
    Pl3.XData = [1 1]*w(i);

    elapsed_time = toc;

    drawnow
    pause(0.1 - elapsed_time)

end
function [ax3,P2,P3] = simulate(fignr,sys,w,t)

fig = figure(fignr);
ax3 = subplot(211);
lsim(sys,sin(w*t),t)
grid on

subplot(212);
bode(sys)
grid on

[ax1,ax2] = find_bode_plot(fig)

subplot(ax1);
hold on
P2 = plot([w w],[-1 1]*10000,'r');

subplot(ax2);
hold on
P3 = plot([w w],[-1 1]*10000,'r');

end

function [ax1,ax2] = find_bode_plot(fig)

N = numel(fig.Children);
isax = logical(zeros(1,N));

for i = 1:N
    isax(i) = isa(fig.Children(i),'matlab.graphics.axis.Axes') && strcmp(fig.Children(i).XScale,'log');
end

fig.Children
isax
AxChildren = fig.Children(isax)
ax1 = AxChildren(end-1);
ax2 = AxChildren(end);

end
Output:
ans =

  5×1 graphics array:

  ContextMenu
  ContextMenu
  Axes
  Axes
  Axes


isax =

  1×5 logical array

   0   0   1   1   0


AxChildren =

  2×1 Axes array:

  Axes
  Axes


ax1 =

  Axes with properties:

             XLim: [0.1000 100]
             YLim: [-181.8000 1.8000]
           XScale: 'log'
           YScale: 'linear'
    GridLineStyle: '-'
         Position: [0.1431 0.1100 0.7619 0.1345]
            Units: 'normalized'

  Use GET to show all properties


ax2 =

  Axes with properties:

             XLim: [0.1000 100]
             YLim: [-79.9874 0]
           XScale: 'log'
           YScale: 'linear'
    GridLineStyle: '-'
         Position: [0.1431 0.2651 0.7619 0.1516]
            Units: 'normalized'

  Use GET to show all properties