Tartalomjegyzék
\[ \newenvironment{dcases}{\left\{\begin{array}{ll}}{\end{array}\right.} \]Function approximation, curve fitting
Teljes Matlab script kiegészítő függvényekkel.
File: gyak7_Chebyshev_Fourier_curve_fitting.m
Directory: 3_oktatas/funkanal
Author: Peter Polcz (ppolcz@gmail.com)
Created on 2018. April 17.
First of all, we compute the norm of the basis functions:
$$\left\|\varphi_k\right\|_\rho = \int_X \varphi_k^2(x) \rho(x) dx, $$
then
$$c_k = \frac{1}{\|\varphi\|_\rho^2}\left<f,\varphi_k\right>_\rho = \int_X f(x) \varphi_k(x) \rho(x) dx$$
Finally:
$$f(x) \simeq \sum_{k=0}^n c_k \varphi_k(x)$$
Fourier expansion on $[0,\pi]$
In this case $\rho(x) = 1$.
$$\varphi_{2k}(x) = cos(kx),~ k = 0,1,2,.... $$
$$\varphi_{2k-1}(x) = sin(kx),~ k = 1,2,...$$
x = linspace(0,pi,100);
f = conv(randn(size(x)), hamming(41), 'same') + 0.6*randn(size(x));

rho = @(x) ones(size(x));
phi = @(n,x) cos(n*x);

n = 10;
C = zeros(1,n+1);
g = f*0;

for k=0:n
    norm_square = trapz(x, phi(k,x).^2 .* rho(x));
    C(k+1) = trapz(x, f .* phi(k,x) .* rho(x)) ./ norm_square;

    g = g + C(k+1) * phi(k,x);
end

figure, hold on
plot(x,f)
plot(x,g, 'LineWidth', 2)

grid on
set(gca, Persist.font_axis18{:}, 'TickLabelInterpreter', 'latex')
xticks((0:0.25:1)*pi)
xticklabels({'0', '$\frac{\pi}{4}$', '$\frac{\pi}{2}$', '$\frac{3\pi}{4}$', '$\pi$'})
xlim([0,pi])

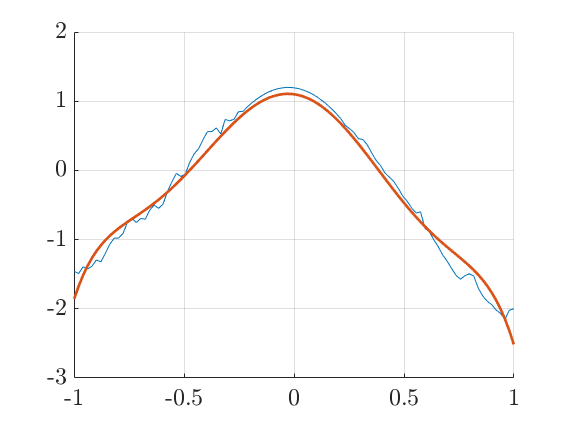
Chebyshev
In this case $\varphi_n(x) = T_n(x)$ and $\rho(x) = \frac{1}{1 - x^2}$.
rho = @(x) 1 ./ sqrt(1 - x.^2);
phi = @chebyshevT;
%phi = @(n,x) cos(n*acos(x));

x = linspace(-0.999,0.999,100);
% f = conv(randn(size(x)), hamming(121), 'same');
f = [ -1.4588 , -1.4903 , -1.3916 , -1.4267 , -1.3818 , -1.2944 , -1.3211 , -1.2006 , -1.0678 , -0.9789 , -0.9777 , -0.9097 , -0.748 , -0.6956 , -0.7515 , -0.6949 , -0.7049 , -0.5758 , -0.5001 , -0.5485 , -0.4891 , -0.3044 , -0.166 , -0.0425 , -0.0882 , -0.0542 , 0.1139 , 0.2382 , 0.3115 , 0.4432 , 0.56 , 0.5613 , 0.6138 , 0.5273 , 0.737 , 0.7165 , 0.7394 , 0.8489 , 0.8528 , 0.9193 , 0.9758 , 1.0262 , 1.0703 , 1.1081 , 1.1395 , 1.1644 , 1.1826 , 1.1942 , 1.1991 , 1.1974 , 1.1889 , 1.1738 , 1.152 , 1.1237 , 1.0889 , 1.0477 , 1.0002 , 0.9466 , 0.887 , 0.8215 , 0.7504 , 0.6527 , 0.6034 , 0.544 , 0.4575 , 0.4457 , 0.3703 , 0.2521 , 0.1436 , 0.0688 , -0.0388 , -0.1011 , -0.1639 , -0.2612 , -0.3718 , -0.4477 , -0.5442 , -0.6164 , -0.5975 , -0.8367 , -0.8913 , -1.0035 , -1.1045 , -1.2235 , -1.3123 , -1.4185 , -1.517 , -1.5728 , -1.5204 , -1.4942 , -1.5276 , -1.7016 , -1.8129 , -1.8903 , -1.9379 , -2.0154 , -2.0664 , -2.1535 , -2.0206 , -1.9994 ];

n = 6;

C = zeros(1,n+1);
g = f*0;

for k=0:n
    norm_square = trapz(x, phi(k,x).^2 .* rho(x));
    C(k+1) = trapz(x, f .* phi(k,x) .* rho(x)) ./ norm_square;

    g = g + C(k+1) * phi(k,x);
end

figure, hold on
plot(x,f)
plot(x,g, 'LineWidth', 2)
xlim([-1 1])

grid on
set(gca, Persist.font_axis18{:}, 'TickLabelInterpreter', 'latex')