Tartalomjegyzék
\[ \newenvironment{dcases}{\left\{\begin{array}{ll}}{\end{array}\right.} \]Dynamic systems' simulation
Teljes Matlab script kiegészítő függvényekkel.
File: ccs_TP_simulation.m
Directory: 4_gyujtemegy/11_CCS/_1_ccs/ccs_2018/TP_2018_09_18
Author: Peter Polcz (ppolcz@gmail.com)
Created on 2018. September 18.
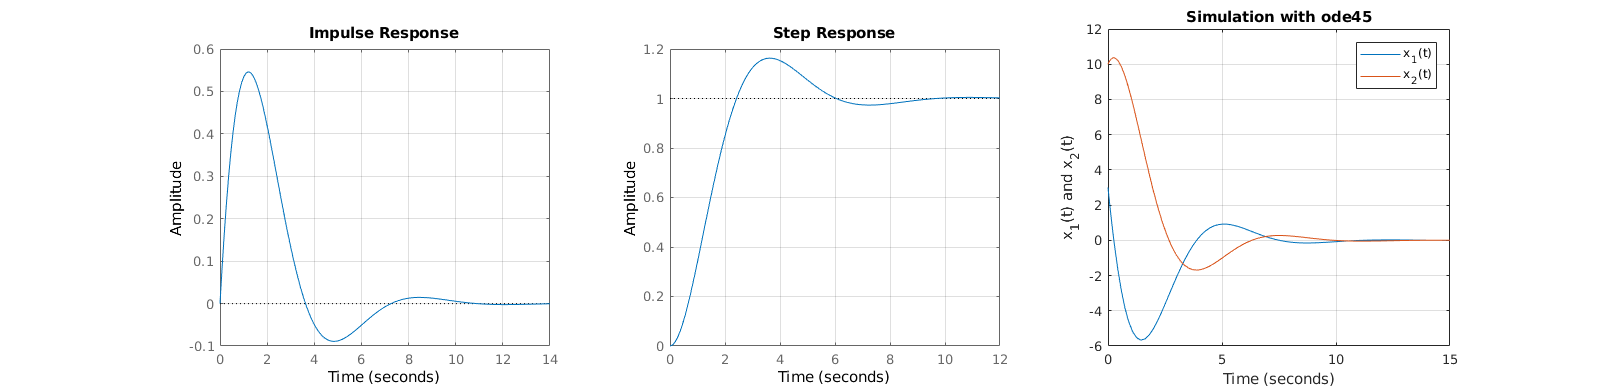
RLC circuit
R = 1;
L = 1;
C = 1;

A = [
    -R/L -1/L
    1/C   0
    ];

B = [
    1/L
    0
    ];

C = [0 1];

D = 0;

sys = ss(A,B,C,D);

figure('Position', [ 211 , 594 , 1594 , 384 ], 'Color', [1 1 1]),
subplot(131), impulse(sys), grid on
subplot(132), step(sys), grid on

[t,x] = ode45(@(t,x) A*x, [0,15],[3;10]);
subplot(133), plot(t,x), grid on
title 'Simulation with ode45'
xlabel 'Time (seconds)'
ylabel 'x_1(t) and x_2(t)'
legend 'x_1(t)' 'x_2(t)'
Lotka Volterra 1.
syms t x1 x2 real
x = [ x1 ; x2 ];

f = [
    x1*(2 - x2)
    x2*(-1 + 0.2*x1)
    ];

xeq = struct2cell(solve(diag(1./x) * f));
xeq = double([xeq{:}])';

f_ode = matlabFunction(f, 'vars', {t,x});

[tt,xx] = ode45(f_ode, [0,10], [1;2]);

figure('Position', [ 613 , 598 , 1048 , 316 ], 'Color', [1 1 1])
subplot(121)
plot(tt,xx), grid on;
legend 'nr of prays' 'nr of predators'

subplot(122), hold on
P = plot(xx(:,1),xx(:,2));
plot(xx(1,1),xx(1,2), '.', 'MarkerSize', 20, 'Color', P.Color)
plot(xeq(1),xeq(2), 'ok', 'MarkerSize', 10)
legend 'trajectory' 'initial condition' 'equilibrium point'
grid on
title 'Phase diagram'
xlabel 'x_1(t)'
ylabel 'x_2(t)'

Lotka Volterra 2.
syms t x1 x2 real
x = [ x1 ; x2 ];

f = [
    x1*(-2*x1-3*x2+5)
    x2*(1.4*x1+x2-2.4)
    ];

xeq = struct2cell(solve(diag(1./x) * f));
xeq = double([xeq{:}])';

f_ode = matlabFunction(f, 'vars', {t,x});

[tt,xx] = ode45(f_ode, [0,10], [0.5;0.5]);

figure('Position', [ 613 , 598 , 1048 , 316 ], 'Color', [1 1 1])
subplot(121)
plot(tt,xx), grid on;
legend 'nr of prays' 'nr of predators'

subplot(122), hold on
P = plot(xx(:,1),xx(:,2));
plot(xx(1,1),xx(1,2), '.', 'MarkerSize', 20, 'Color', P.Color)
plot(xeq(1),xeq(2), 'ok', 'MarkerSize', 10)
legend 'trajectory' 'initial condition' 'equilibrium point'
grid on
title 'Phase diagram'
xlabel 'x_1(t)'
ylabel 'x_2(t)'

Terminal event for ode45
term = odeset('Events',@odeterminalevent);
A = [1 0 ; 0 2];
figure, ode45(@(t,x) A*x, [0,1000],[0;0.1], term), grid on

Fermentation process
syms t x1 x2 real
x = [ x1 ; x2 ];

V = 4;
Sf = 10;
Y = 0.5;
mu_max = 1;
K1 = 0.03;
K2 = 0.5;
F = 3.2;

mu = mu_max * x2 ./ (K2*x2.^2 + x2 + K1);

f = [
    mu*x1 - x1*F/V
    -mu*x1/Y + (Sf-x2)*F/V
    ];

f_ode = matlabFunction(f, 'vars', {t,x});

xeq = struct2cell(solve(f));
xeq = double([xeq{:}])';

stable = matlabFunction(eig(jacobian(f)), 'vars', {x});
stable(xeq(:,2))

xeq = xeq(:,2);

term = odeset('Events',@brmterminalevent);

convColor = [0.8 0.1 0.1];
divColor = [0.3 0.1 0.5];

figure('Position', [ 676 , 312 , 868 , 667 ], 'Color', [1 1 1]), hold on
plot(xeq(1),xeq(2),'ok','LineWidth',3,'MarkerSize',10)
axis equal, grid on
for i = 1:100
    x0 = xeq + 0.2*randn(2,1);

    if any(x0 < 0), continue, end

    [tt,xx] = ode45(f_ode, [0,10], x0, term);

    if norm(xx(end,:)-xeq') < 0.1
        color = convColor;
    else
        color = divColor;
    end

    plot(xx(:,1),xx(:,2), 'Color', color);
    plot(xx(1,1),xx(1,2),'.','MarkerSize',20,'Color',color);
    drawnow
end
Output:
ans =
   -0.8000
   -1.5680
