Tartalomjegyzék
\[ \newenvironment{dcases}{\left\{\begin{array}{ll}}{\end{array}\right.} \]Estimate DOA with a Lyapunov function
Teljes Matlab script kiegészítő függvényekkel.
File: ccs_nonlin_Van_der_Pol_Lyapunov.m
Author: Peter Polcz (ppolcz@gmail.com)
Created on 2018. August 26.
System model
syms t x1 x2 real
x = [
x1
x2
];
mu = 1;
f_sym = [
-x2
x1 - mu*(1 - x1^2)*x2
];
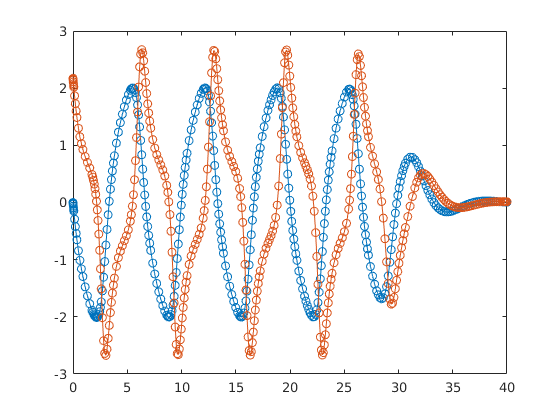
f_ode = matlabFunction(f_sym, 'vars', {t x});
ode45(f_ode, [0 40],[0 2.1719978066864]');
Estimate DOA with a simple Lyapunov function
V = x1^2 + x2^2;

dV = jacobian(V,x) * f_sym;

V_fh = matlabFunction(V);
dV_fh = matlabFunction(dV);

[x1_num,x2_num] = meshgrid(linspace(-4,4,100));

V_num = V_fh(x1_num, x2_num);
dV_num = dV_fh(x1_num, x2_num);

figure, hold on, grid on

% Highlight the area where dV is NOT negative
handle = pcolor(x1_num, x2_num, double(dV_num > 0));
set(handle, 'EdgeAlpha', 0, 'FaceAlpha', 0.5);
colormap default
colormap([1 1 1 ; colormap]);

% Plot the contour lines of V
contour(x1_num, x2_num, V_num, [ 0.1 0.2 0.3 linspace(0.5,50,40) ]);

% This is the maximal contour line which lies completely inside the
% admissible zone
[C,h] = contour(x1_num, x2_num, V_num, [1 1], 'LineWidth', 5, 'Color', [0 0.5 0]);
clabel(C,h)
% Plot the true domain of attraction
[tt,xx] = ode45(f_ode, [0 10],[0 2.1719978066864]');
plot(xx(:,1),xx(:,2),'LineWidth',4,'Color',[0.8 0 0])

legend 'Blue area: where d/dt V(x) > 0' ...
    'Contour lines of V(x)' ...
    'Estimated domain of attraction' ...
    'True domain of attraction'

Estimate DOA with a more complicated Lyapunov function
V = 13*x1^2 + 11*x2^2 - 6*x1*x2;

dV = jacobian(V,x) * f_sym;

V_fh = matlabFunction(V);
dV_fh = matlabFunction(dV);

[x1_num,x2_num] = meshgrid(linspace(-4,4,300));

V_num = V_fh(x1_num, x2_num);
dV_num = dV_fh(x1_num, x2_num);

figure, hold on, grid on

% Highlight the area where dV is NOT negative
handle = pcolor(x1_num, x2_num, double(dV_num > 0)*50);
set(handle, 'EdgeAlpha', 0, 'FaceAlpha', 0.5);
colormap default
colormap([1 1 1 ; colormap]);

% Plot the contour lines of V
contour(x1_num, x2_num, V_num, [ 0.1 0.2 0.3 linspace(0.5,700,40) ]);

% This is the maximal contour line which lies completely inside the
% admissible zone
[C,h] = contour(x1_num, x2_num, V_num, [1 1]*20, 'LineWidth', 5, 'Color', [0 0.5 0]);
clabel(C,h)

% Plot the true domain of attraction
[tt,xx] = ode45(f_ode, [0 10],[0 2.1719978066864]');
plot(xx(:,1),xx(:,2),'LineWidth',4,'Color',[0.8 0 0])

legend 'Blue area: where d/dt V(x) > 0' ...
    'Contour lines of V(x)' ...
    'Estimated domain of attraction' ...
    'True domain of attraction'
