Tartalomjegyzék
\[ \newenvironment{dcases}{\left\{\begin{array}{ll}}{\end{array}\right.} \]Inverted pendulum control with nonlinear feadback and output selection
Teljes Matlab script kiegészítő függvényekkel.
File: ccs_invpend_LQR_nonlin_control_szed2002.m
Directory: 4_gyujtemegy/11_CCS/_2_nonlin-pannon/invpend_nonlin_control
Author: Peter Polcz (ppolcz@gmail.com)
Created on 2018. July 30.
Inherited from
File: pcz_nonlinearControl.m (2014)
Automatically generated stuff
global SCOPE_DEPTH VERBOSE LATEX_EQNR
SCOPE_DEPTH = 0;
VERBOSE = 1;
LATEX_EQNR = 0;

try c = evalin('caller','persist'); catch; c = []; end
persist = Persist(mfilename('fullpath'), c); clear c;
persist.backup();
%clear persist
Output:
[  <strong>INFO </strong> ] Persistence for `ccs_invpend_LQR_nonlin_control_szed2002` reused (inherited) [run ID: 0931, 2018.07.30. Monday, 10:43:03]
[  <strong>INFO </strong> ] Script `ccs_invpend_LQR_nonlin_control_szed2002` backed up.
Control design
visualization = 0;
use_kalman_instead_of_simple_state_estimator = 1;
full_state_estimation = 1;

% constants:
M = 1.5;
m = 0.2;
b = 0;
g = 9.81;
l = 1;
Ts = 0.016;
dim = 4;

T0 = 0;
T1 = 10;
N = (T1 - T0) / Ts;

% by my own calculations:
A = [0  1              0                    0;
     0  -4*b/(m+4*M)   3*g*m/(m+4*M)        0;
     0  0              0                    1;
     0  -3*b/(m+4*M)/l  3*g*(m+M)/l/(m+4*M)  0];

B = [0;
     4/(m+4*M);
     0;
     3/(m+4*M)/l];

C = [1 0 0 0;
     0 0 1 0];

D = [0; 0];

Q = diag([1, 1, 1, 1]);

% generating state space system
sysc = ss(A,B,C,D);
[K,~,~] = lqr(A,B,Q,0.5, 0);
pcz_debugw(K)

% discretization - only A and B needed to be updated
sysd = c2d(sysc, Ts);
A = sysd.A;
B = sysd.B;

% lqr feedback gain generation
[K,~,~] = dlqr(A, B, Q, 0.5, 0);
pcz_debugw(K)

% a Matlab szimulacio valtozoi
sx = zeros(4,N);
su = zeros(1,N);
Output:
-----------------------------------------------------------------
K =    -1.4142   -3.6234   55.2773   19.8726
 - ccs_invpend_LQR_nonlin_control_szed2002.m:66
 - evalmxdom.m:109
 - evalmxdom.m:21
 - publish.p:191
 - publish_with_soup.m:32
-----------------------------------------------------------------

-----------------------------------------------------------------
K =    -1.3342   -3.4294   53.3680   19.1773
 - ccs_invpend_LQR_nonlin_control_szed2002.m:75
 - evalmxdom.m:109
 - evalmxdom.m:21
 - publish.p:191
 - publish_with_soup.m:32
-----------------------------------------------------------------
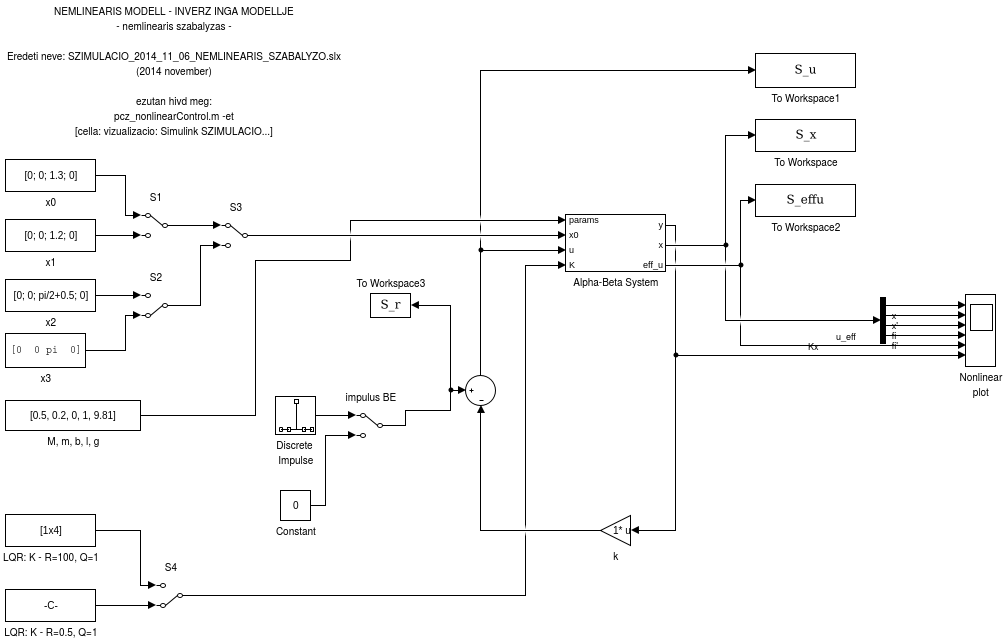
Download the Simulink model: invpend_simulation.slx
Main model
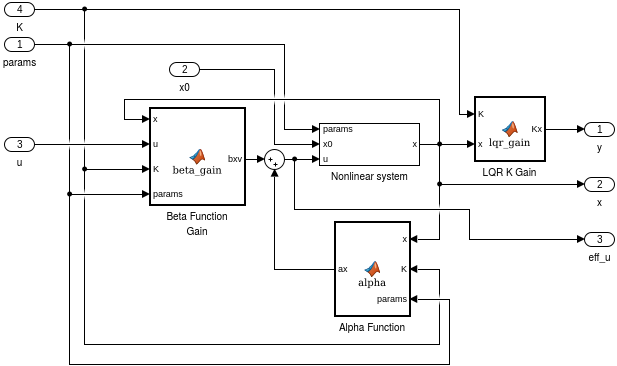
Alpha-Beta System submodel
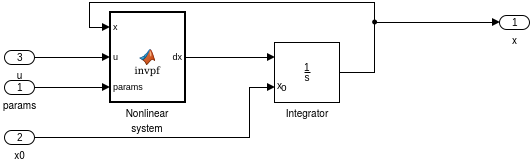
Nonlinear system submodel
open_system invpend_simulation
print -dpng fig/sim.png -sinvpend_simulation
print -dpng fig/sim_ab.png '-sinvpend_simulation/Alpha-Beta System'
print -dpng fig/sim_ab_nonlin.png '-sinvpend_simulation/Alpha-Beta System/Nonlinear system'
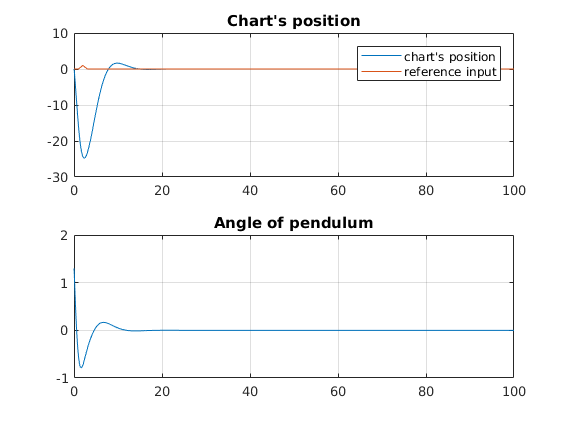
Plot
t = S_x.Time';

l = 1;
cl = 1;
cw = 0.1;

T0 = t(1);
T1 = t(end);
fps = 15;
Ts = 1/fps;
nr_samples = (T1-T0) * fps;
t_ = linspace(T0, T1, nr_samples);

Data = interp1(S_x.Time, S_x.Data, t_');
x = Data(:,1)';
fi = Data(:,3)';
ref = interp1(S_r.Time, squeeze(S_r.Data), t_');
% 2018.07.30. (július 30, hétfő), 09:56 [korrigálás: squeeze]

x_init = x;
x1 = x_init - l*sin(fi);
y1 = l*cos(fi);

% angle of the pendulum: phi
figure, subplot(212);
plot(t_, fi), title('Angle of pendulum'), grid on;

% chart's position
subplot(211)
plot(t_, [x' ref]), title('Chart''s position'), grid on;
legend('chart''s position', 'reference input', 'actual time step');

max_fi = max(fi);
min_fi = min(fi);
max_x = max(x);
min_x = min(x);

in_Time = 64;

return
Video [TODO]
figure('Position', [ 378 , 103 , 1312 , 821 ], 'Color', [1 1 1]);

t = S_x.Time';

l = 1;
cl = 1;
cw = 0.1;

T0 = t(1);
T1 = t(end);
fps = 15;
Ts = 1/fps;
nr_samples = (T1-T0) * fps;
t_ = linspace(T0, T1, nr_samples);

Data = interp1(S_x.Time, S_x.Data, t_');
x = Data(:,1)';
fi = Data(:,3)';
ref = interp1(S_r.Time, squeeze(S_r.Data), t_');
% 2018.07.30. (július 30, hétfő), 09:56 [korrigálás: squeeze]

x_init = x;
x1 = x_init - l*sin(fi);
y1 = l*cos(fi);

% angle of the pendulum: phi
subplot(221), hold on;
plot(t_, fi), title('Angle of pendulum'), grid on;

% chart's position
subplot(222), hold on;
plot(t_, [x' ref]), title('Chart''s position'), grid on;

max_fi = max(fi);
min_fi = min(fi);
max_x = max(x);
min_x = min(x);

subplot(2,2,[3 4])
Movie = moviein(length(fi));
for kk = 1:nr_samples
    tic

    % angle of the pendulum: phi
    subplot(221);
    plot(t_, fi), title('Angle of pendulum'), grid on, hold on;
    plot([t_(kk), t_(kk)], [min_fi, max_fi], 'r'), hold off;

    % chart's position
    subplot(222);
    plot(t_, x), title('Chart''s position'), grid on, hold on;
    plot([t_(kk), t_(kk)], [min_x, max_x], 'r'), hold off;

    subplot(2,2,[3 4]),
    plot([x_init(kk)-cl/2, x_init(kk)-cl/2, x_init(kk)+cl/2, x_init(kk)+cl/2, x_init(kk)-cl/2], [-cw/2, cw/2, cw/2, -cw/2, -cw/2])
    hold on;
    plot([x_init(kk); x1(kk)],[0; y1(kk)],'b-'),
    plot(x1(kk), y1(kk), 'o'), title('Simulation');
    axis equal,
%     axis([110 140 -2 2]), grid on;
    axis([-20.2 20.2 -2 2]), grid on;
    hold off;
    pause(max(Ts-toc,0));
end