Contents
file:   pde_heat_transfer_2D_v1.m
author: Polcz Péter <ppolcz@gmail.com>
Created on 2016.12.07. Wednesday, 13:38:48
% fname: full path of the actual file
pcz_cmd_fname('fname');
persist = pcz_persist(fname);
%persist.backup();
Heat Equation on a Square Plate
The basic heat equation is

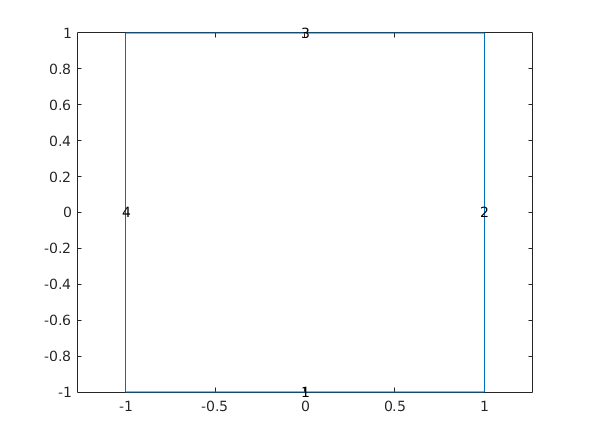
Geommetry 0
L = 1;
xyRect = [-L -L ; L -L ; L L ; -L L];
pdeGeom0 = geomDataFromPolygon(xyRect);

figure, pdegplot(pdeGeom0, 'edgeLabels', 'on'), axis equal
Geommetry 1
% Create a geometry entity and append to the pde model
L = 1;
nHoles = 2;
R = 2*L/(2+2*nHoles+(nHoles-1));
xyRect = [-L -L ; L -L ; L L ; -L L];

holes = zeros(nHoles*nHoles,3);
holeCounter =1;
x = -L + 2*R;
for i = 1:nHoles
    y = -L + 2*R;
    for j = 1:nHoles
        holes(holeCounter,:) = [x y R];
        holeCounter = holeCounter + 1;
        y = y + 3*R;
    end
    x = x+3*R;
end
pdeGeom1 = [...
    geomDataFromPolygon(xyRect) ...
    geomDataFromPolygon([-0.7 -0.7 ; -0.7 -0.3 ; -0.3 -0.3]) ...
    geomDataOfCircularHoles(holes([2,3],:)) ...
    ];

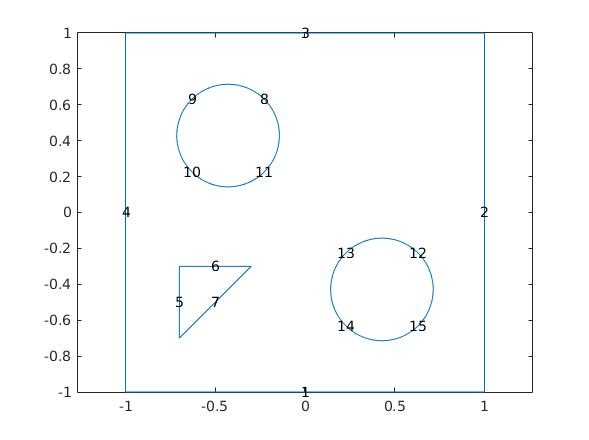
figure, pdegplot(pdeGeom1, 'edgeLabels', 'on'), axis equal
Geommetry 2
% Create a geometry entity and append to the pde model
L = 1;
nHoles = 2;
R = 2*L/(2+2*nHoles+(nHoles-1));
xyRect = [-L -L ; L -L ; L L ; -L L];

smile = [
    -0.8062   -0.5084
    -0.4860   -0.6770
    -0.1601   -0.7388
    0.4466   -0.8511
    0.6376   -0.6096
    0.6994   -0.2949
    0.4972   -0.1433
    0.3399   -0.3230
    -0.0534   -0.4803
    -0.3399   -0.3174
    -0.6096   -0.1264
    ];

nose = [
   -0.0362    0.2563
   -0.1532   -0.2006
    0.0139   -0.0613
    ];

holes = zeros(nHoles*nHoles,3);
holeCounter =1;
x = -L + 2*R;
for i = 1:nHoles
    y = -L + 2*R;
    for j = 1:nHoles
        holes(holeCounter,:) = [x y R];
        holeCounter = holeCounter + 1;
        y = y + 3*R;
    end
    x = x+3*R;
end
pdeGeom2 = [...
    geomDataFromPolygon(xyRect) ...
    geomDataFromPolygon(smile) ...
    geomDataFromPolygon(nose) ...
    geomDataOfCircularHoles(holes([2,4],:)) ...
    ];

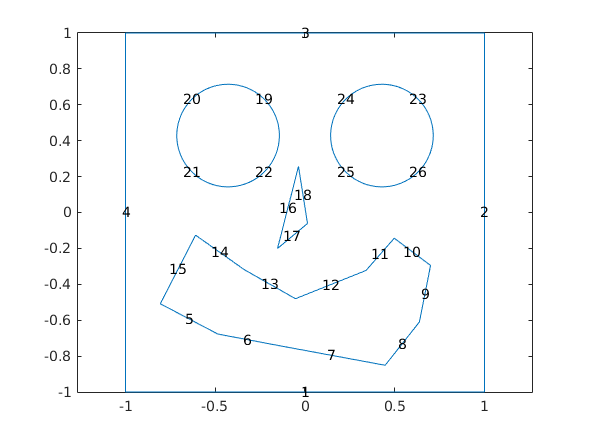
figure, pdegplot(pdeGeom2, 'edgeLabels', 'on'), axis equal
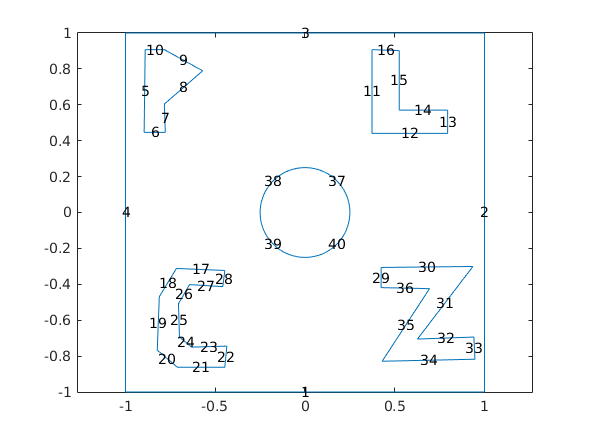
Geommetry 3 - EGO
% Create a geometry entity and append to the pde model
L = 1;
nHoles = 1;
R = 2*L/(2+2*nHoles+(nHoles-1));
xyRect = [-L -L ; L -L ; L L ; -L L];

P = [
   -0.8904    0.9073
   -0.8961    0.4466
   -0.7781    0.4466
   -0.7837    0.6039
   -0.5702    0.7893
   -0.7837    0.9073
   ];

L = [
    0.3736    0.9073
    0.3736    0.4410
    0.7949    0.4410
    0.7949    0.5702
    0.5253    0.5702
    0.5253    0.9017
    ];

C = [
   -0.4466   -0.3230
   -0.7163   -0.3118
   -0.8118   -0.4691
   -0.8230   -0.7669
   -0.7107   -0.8624
   -0.4466   -0.8624
   -0.4354   -0.7444
   -0.6320   -0.7500
   -0.6994   -0.6938
   -0.7051   -0.5084
   -0.6433   -0.4017
   -0.4579   -0.4129
   ];

Z = [
    0.4242   -0.4185
    0.4242   -0.3062
    0.9354   -0.3006
    0.6264   -0.7051
    0.9410   -0.6938
    0.9466   -0.8174
    0.4298   -0.8287
    0.6938   -0.4242
    ];

pdeGeom3 = [...
    geomDataFromPolygon(xyRect) ...
    geomDataFromPolygon(P) ...
    geomDataFromPolygon(L) ...
    geomDataFromPolygon(C) ...
    geomDataFromPolygon(Z) ...
    geomDataOfCircularHoles([0 0 0.25]) ...
    ];

figure, pdegplot(pdeGeom3, 'edgeLabels', 'on'), axis equal
PDE model
Create a PDE Model with a single dependent variable
numberOfPDE = 1;
pdem = createpde(numberOfPDE);

pdeGeom = pdeGeom1;
geometryFromEdges(pdem,pdeGeom);
Problem Definition
k = 0.025;

c = k;
a = 0;
f = 0;
d = 1;
Apply Boundary Conditions
% Solution is zero at all four outer edges of the square
applyBoundaryCondition(pdem,'Edge',1:size(pdeGeom,2), 'u', 0);
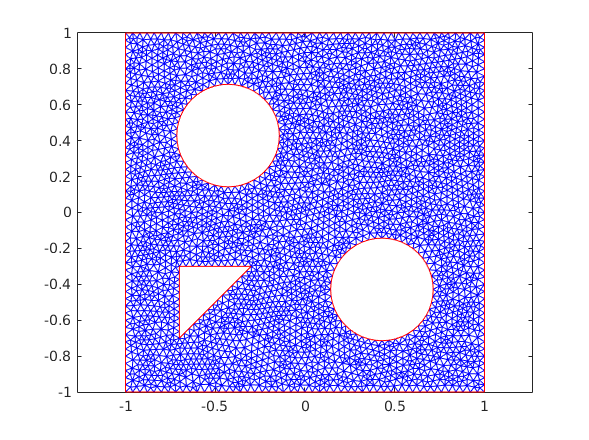
Generate Mesh
msh = generateMesh(pdem,'Hmax',0.04);
figure;
pdemesh(pdem);
axis equal
Initial Conditions
[p,~,t] = meshToPet(msh);
if 1
    u0 = ones(size(p,2),1);
else
    u0 = zeros(size(p,2),1);
    ix = find(sqrt(p(1,:).^2+p(2,:).^2)<0.5);
    u0(ix) = ones(size(ix)) * 1.2;
end
Idointervallum, lepeskoz
nframes = 50;
tlist = linspace(0,1,nframes);
Itt tortenik a PDE megoldasa
u1 = parabolic(u0,tlist,pdem,c,a,f,d);
66 successful steps
0 failed attempts
134 function evaluations
1 partial derivatives
16 LU decompositions
133 solutions of linear systems
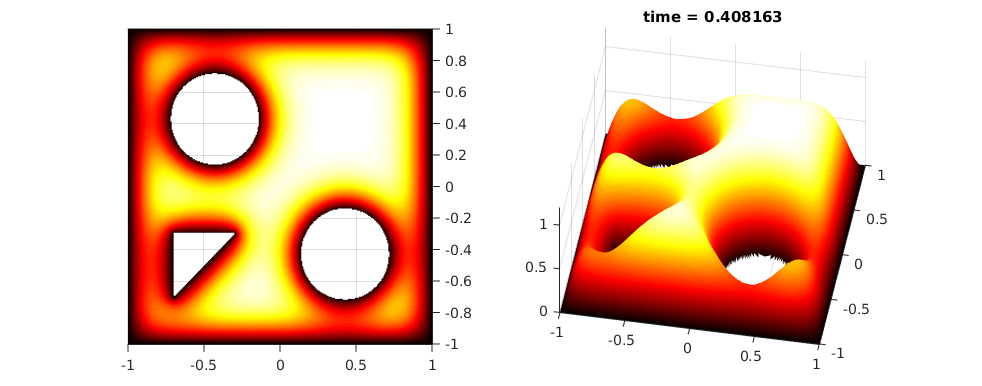
Plot FEM Solution
To speed up the plotting, we interpolate to a rectangular grid.
fig = figure('Position', [168 562 982 386], 'Color', 'white');
colormap(hot);
x = linspace(-1,1,301);
y = x;
[~,tn,a2,a3] = tri2grid(p,t,u0,x,y);
umax = max(max(u1));
umin = min(min(u1));

for j = 21 % 1:nframes,
    u = tri2grid(p,t,u1(:,j),tn,a2,a3);

    figure(fig)
    subplot(121);
    surf(x,y,u);
    view([0,89.999])
    caxis([umin umax]);
    axis([-1 1 -1 1 0 2]);
    shading interp;

    subplot(122);
    surf(x,y,u);
    view([10,60])
    caxis([umin umax]);
    axis([-1 1 -1 1 0 1.2]);
    shading interp;
    title(sprintf('time = %g', tlist(j)))

    pause(0.05)

    if j == 20
        drawnow
        persist.savefig(fig, 'heat_diffusion_poster.png');
        pause(0.5)
    end

    % Felvétel
    % frames(j) = getframe(fig);
end

% v = VideoWriter(persist.timefl('fig','heat_diffusion.avi'));
% open(v)
% writeVideo(v,frames)
% close(v)
